stackplot
时间:2014-11-04 19:34:42
收藏:0
阅读:269
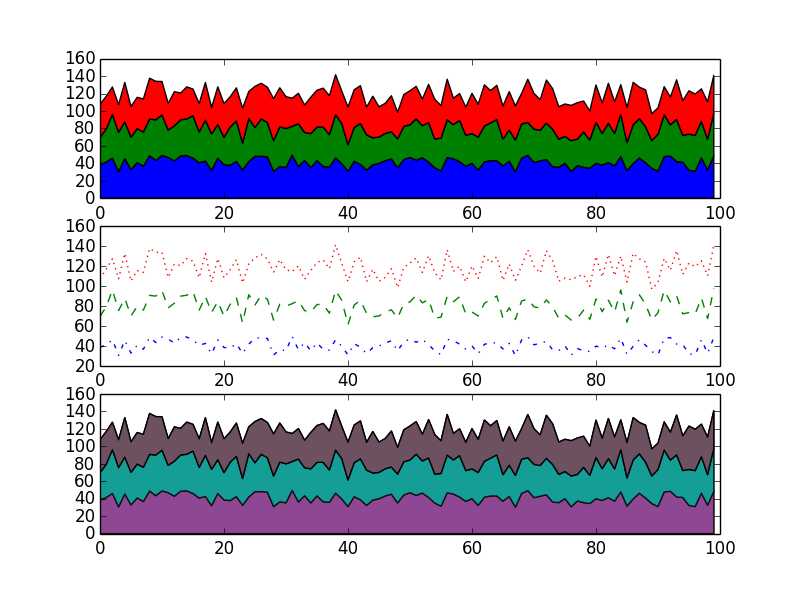
# -*- coding: utf-8 -*-
"""
Created on Tue Nov 04 15:46:32 2014

@author: dell
"""

import numpy as np
import matplotlib.pyplot as plt

if __name__ == ‘__main__‘:
    mylist = [np.random.uniform(30, 50, 100) for i in range(3)]
    #mylist = [np.random.randint(30, 50, 100) for i in range(3)]
    y = np.row_stack(mylist)

    x = range(0, 100)

    fig = plt.figure()
    ax1 = fig.add_subplot(311)
    ax1.stackplot(x, y)
    #plt.show()

    ax2 = fig.add_subplot(312)
    ax2.plot(x,mylist[0], ‘-.‘)
    ax2.plot(x,sum(mylist[0:2]), ‘--‘)
    ax2.plot(x,sum(mylist[0:3]), ‘:‘)

    ax3 = fig.add_subplot(313)
    ax3.stackplot(x, y)
    y_stack = np.cumsum(y, axis=0)
    ax3.fill_between(x, 0, y_stack[0,:], facecolor="#CC6666", alpha=.7)
    ax3.fill_between(x, y_stack[0,:], y_stack[1,:], facecolor="#1DACD6", alpha=.7)
    ax3.fill_between(x, y_stack[1,:], y_stack[2,:], facecolor="#6E5160")

    plt.show()
原文:http://www.cnblogs.com/hluo/p/4074343.html
评论(0)