
matlab画频率分布直方图
时间:2020-08-01 21:59:06
收藏:0
阅读:456
Generate 10,000 random numbers and create a histogram. Thehistogramfunction automatically chooses
an appropriate number of bins to cover the range of values inxand show the shape of the
underlying distribution.
x = randn(10000,1);
h = histogram(x)
randn(100001)产生10 000个均值 0,标准差
0,标准差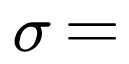 1的正态分布随机数。

原文:https://www.cnblogs.com/yibeimingyue/p/13416042.html
评论(0)