理解 fig,ax = plt.subplots()
时间:2020-04-19 09:22:16
收藏:0
阅读:1279
1. 在matplotlib中,我最常用
plt.figure(figsize=(a,b))
其中,a,b为画布的宽和高

2. 如果是要画多个子图这样的形式,我一般使用
也就是使用
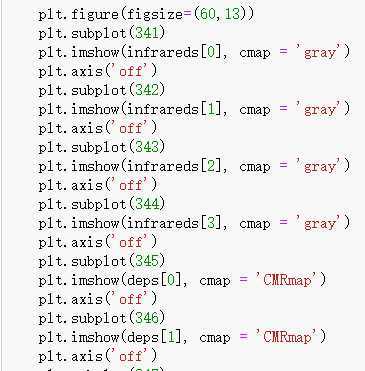
plt.figure(figsize=(60,13))

plt.subplot(121)   # 1行2列,第1个图


plt.subplot(122)   # 1行2列,第2个图
画出的图如下:
3. 现在我见到这样的形式:
fig, ax = plt.subplots(figsize = (a, b))
和之前的啥关系?
fig代表绘图窗口(Figure);ax代表这个绘图窗口上的坐标系(axis),一般会继续对ax进行操作。
fig, ax = plt.subplots()
等价于:
fig = plt.figure()
ax = fig.add_subplot(1, 1, 1)
例如:
fig, ax = plt.subplots(1,3)
其中1,3表示1行3列的子图,一共1*3个子图像。也就是函数返回一个figure图像和子图ax的array列表。
如果想设置子图的宽和高可以加入参数figsize
fig, ax = plt.subplots(1,3,figsize=(15,7))
原文:https://www.cnblogs.com/ivyharding/p/12728920.html
评论(0)