XDebug调试
时间:2019-10-23 09:23:37
收藏:0
阅读:87
安装
- 访问Xdebug
- 点击download
找到RELEASES,点击
custom installation instructions.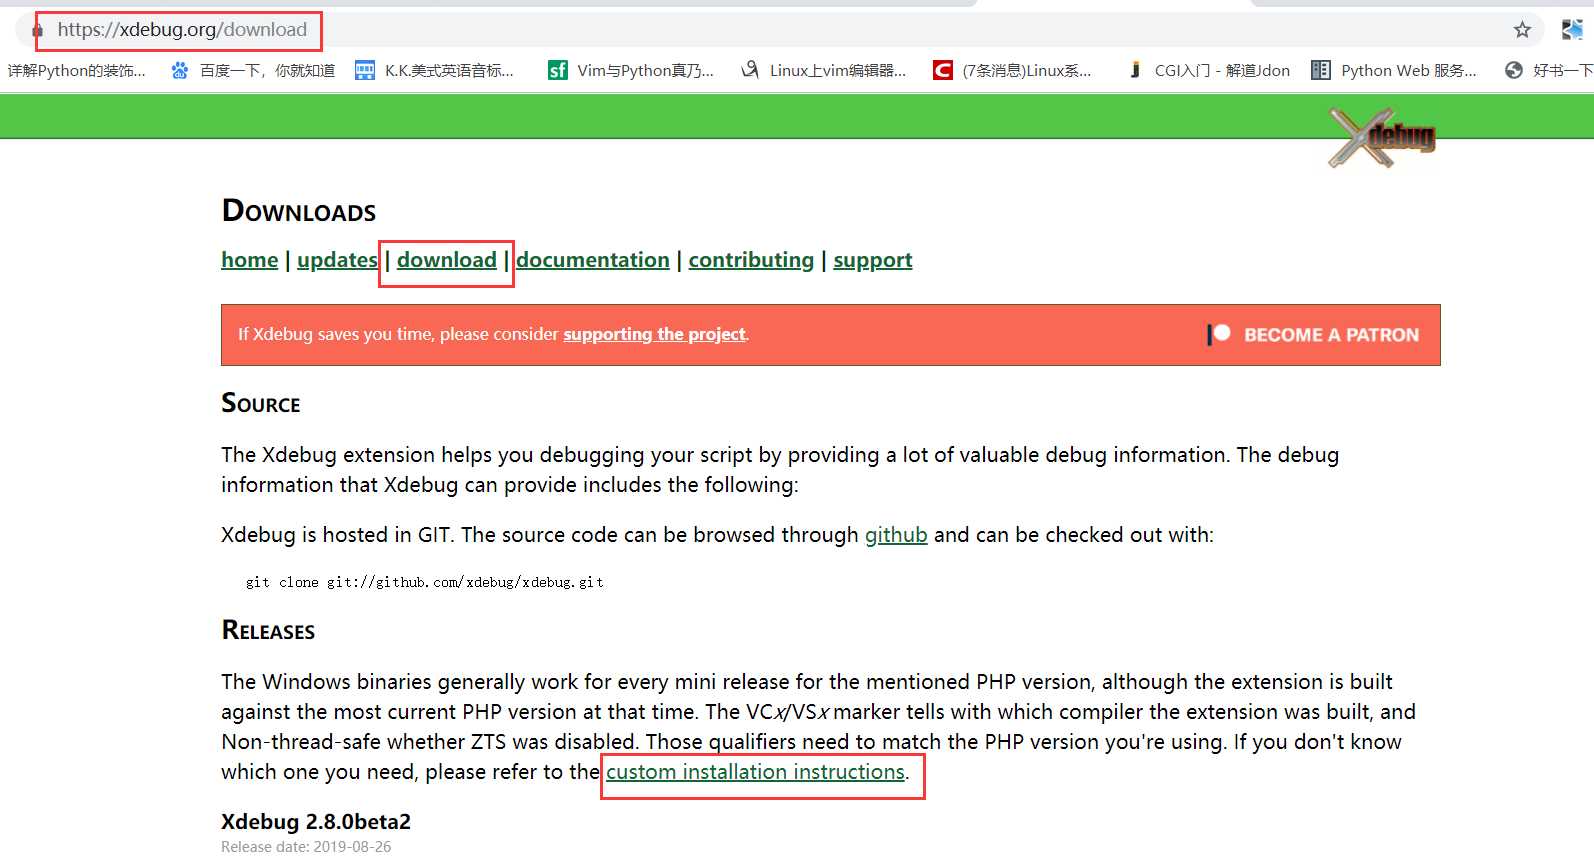
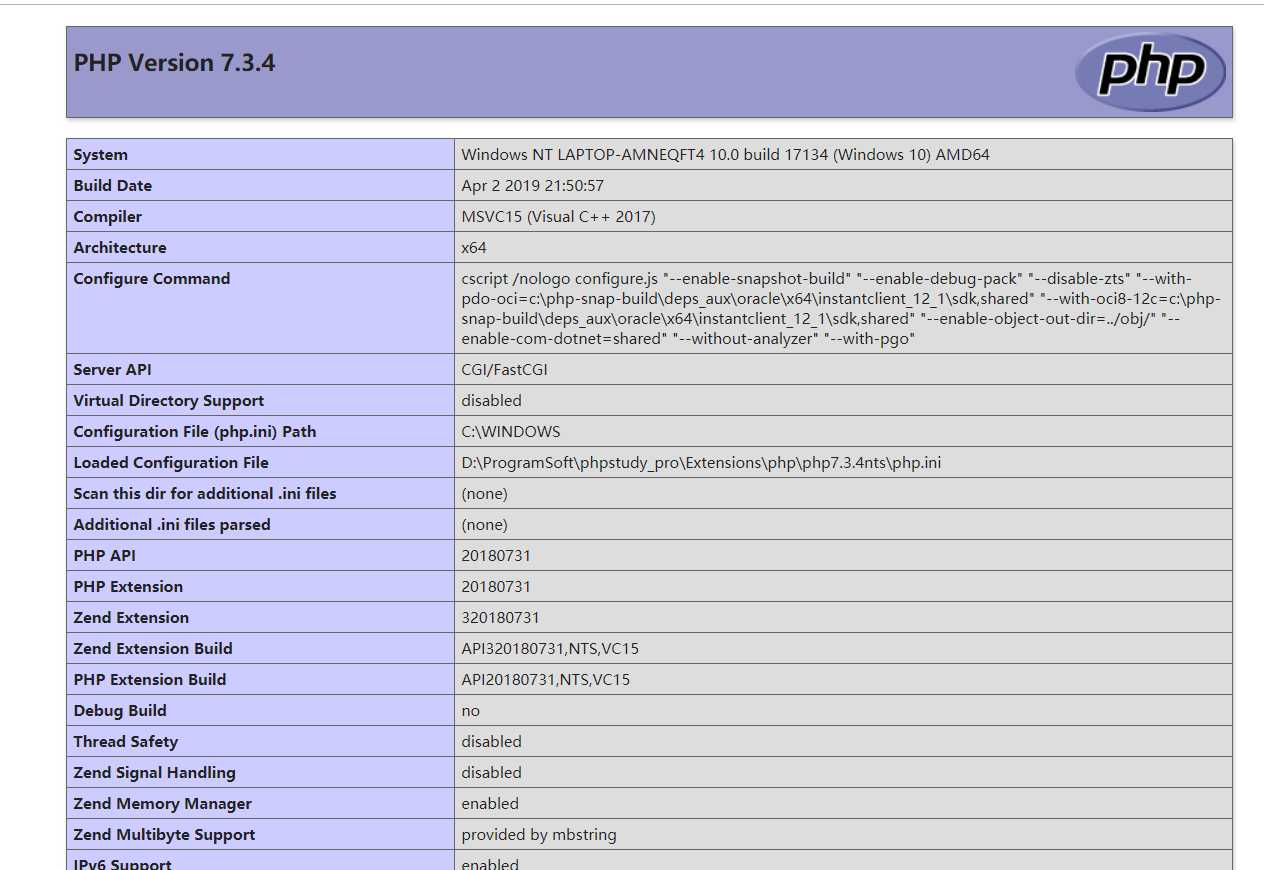
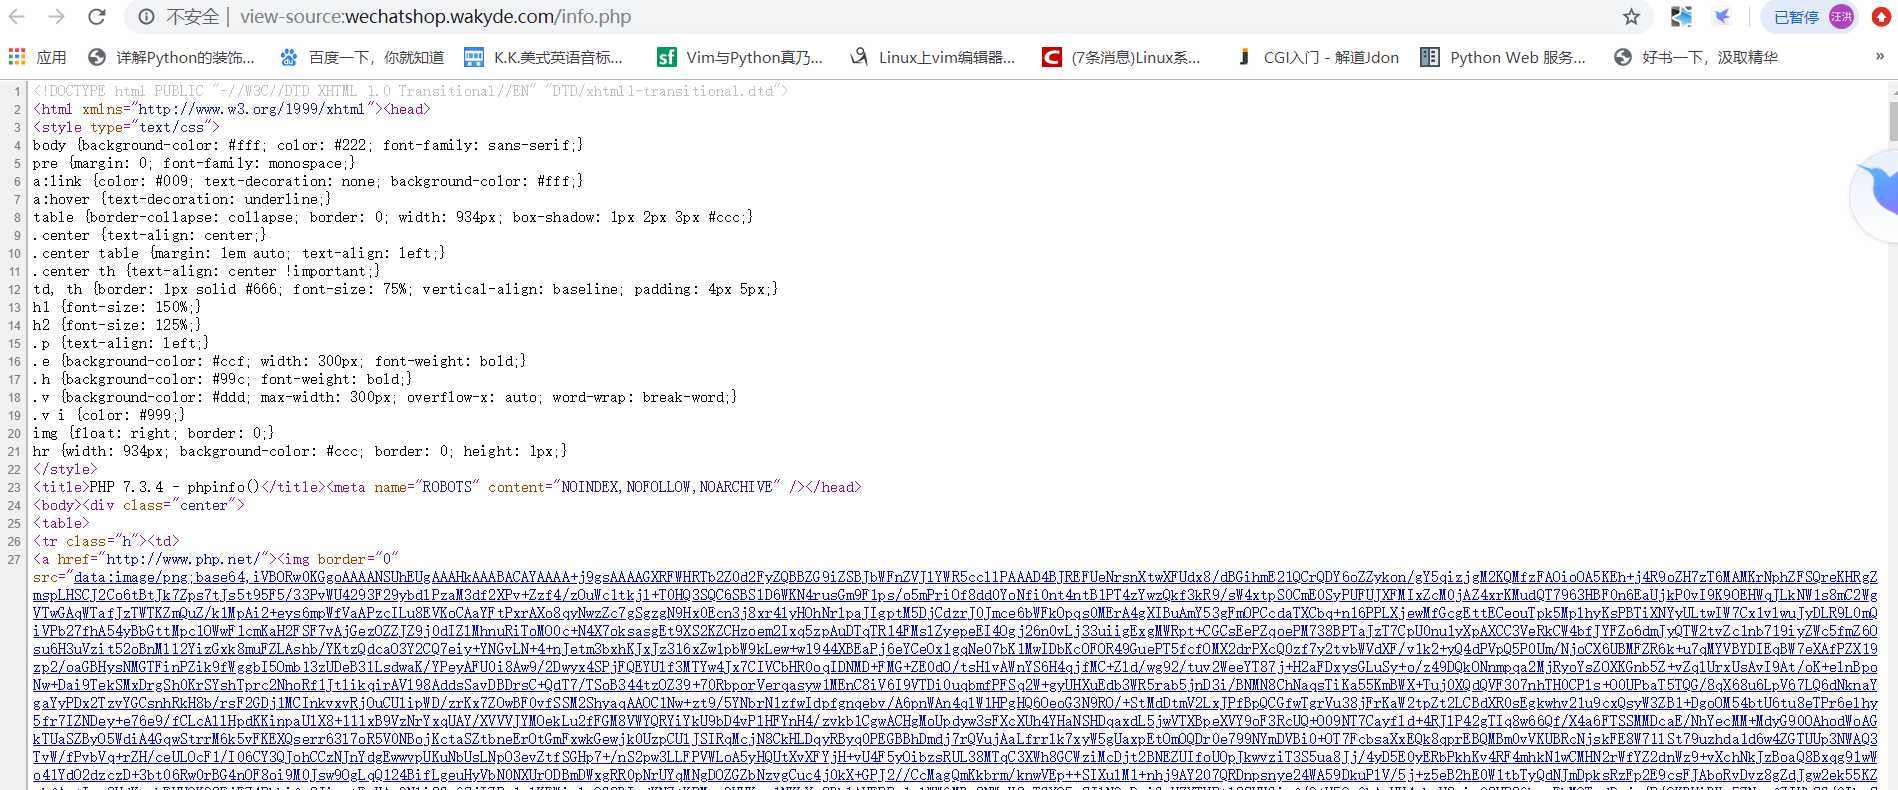
在白色框框内填入phpinfo()出来的源码
点击Analyse my phpinfo() output
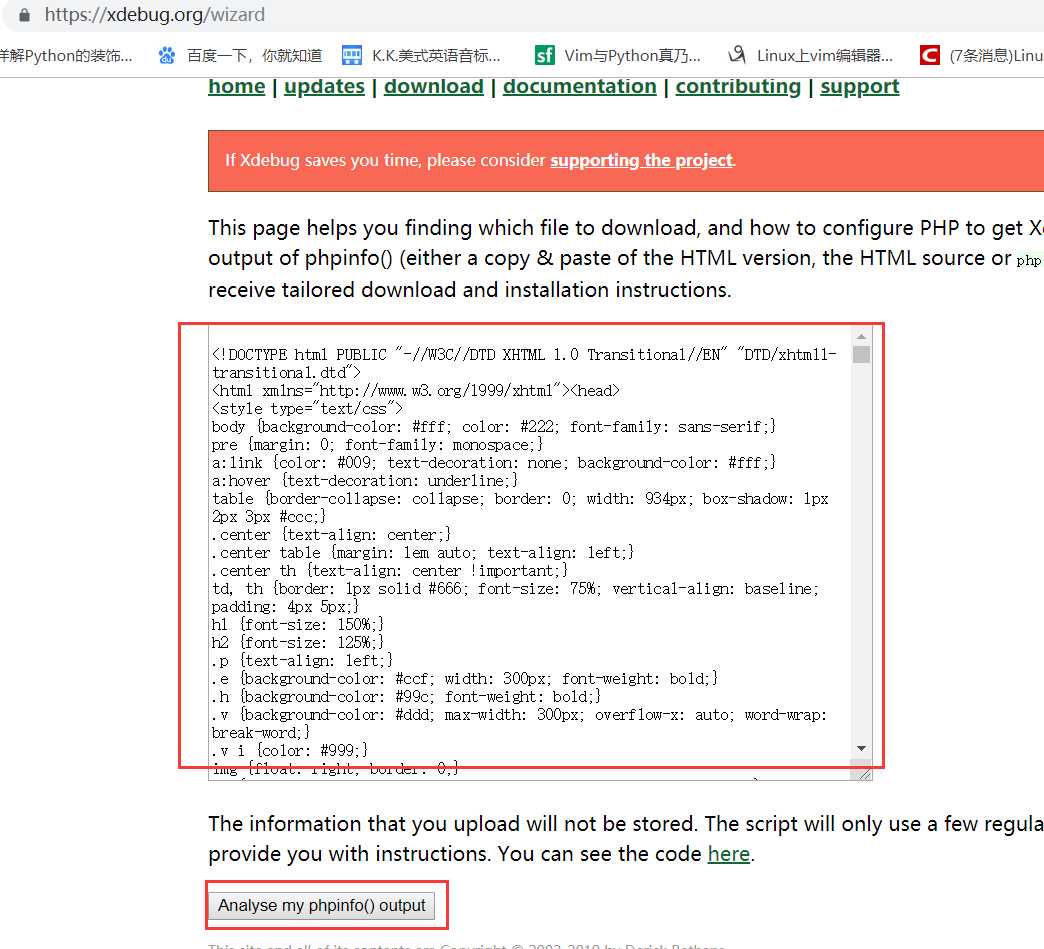
然后下载
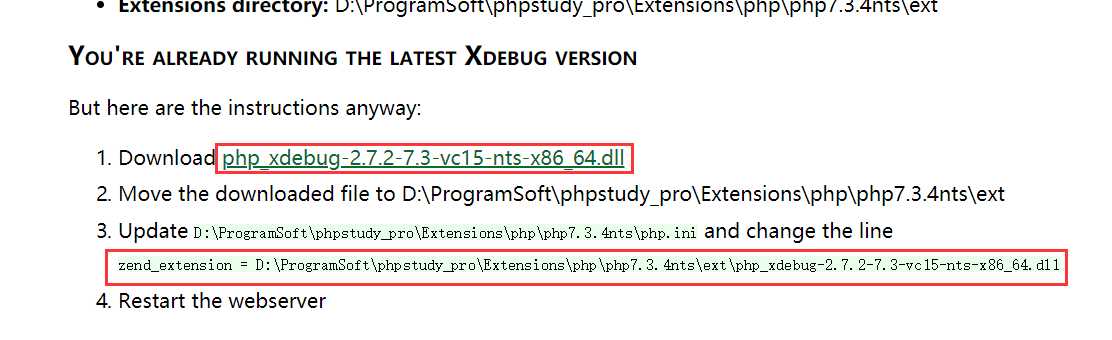
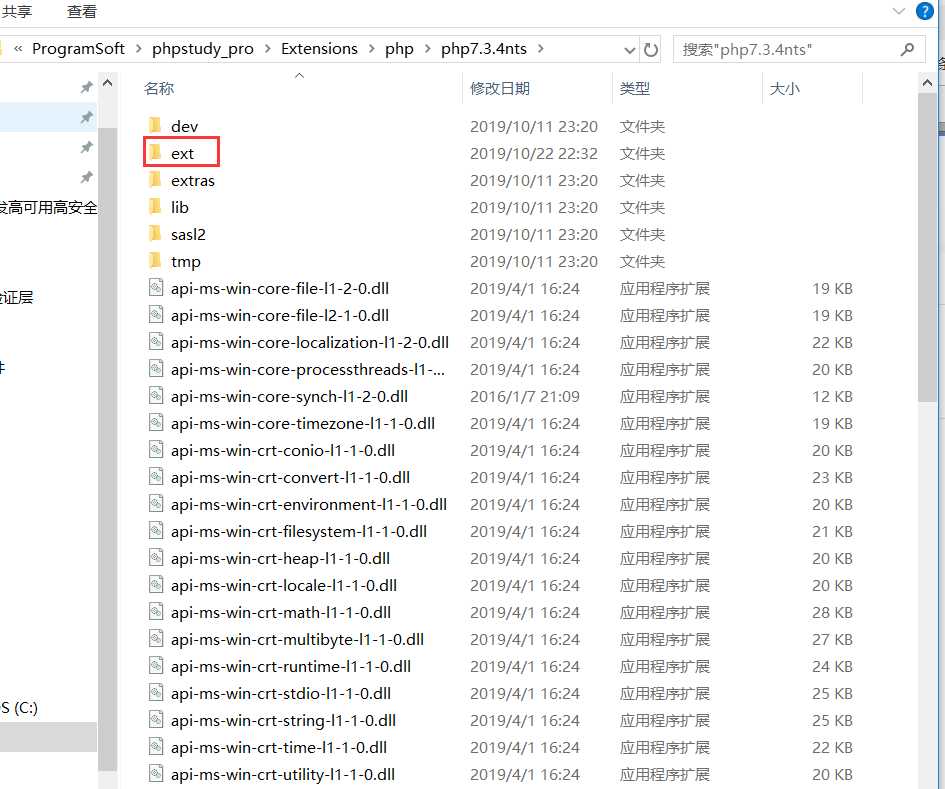
将下载好的dll文件放到php路径下ext文件的里面
配置php.ini
[Xdebug]
zend_extension = D:\ProgramSoft\phpstudy_pro\Extensions\php\php7.3.4nts\ext\php_xdebug-2.7.2-7.3-vc15-nts-x86_64.dll
xdebug.profiler_append = 0

xdebug.profiler_enable = 1

xdebug.profiler_enable_trigger = 0

xdebug.profiler_output_dir ="D:\ProgramSoft\phpstudy_pro\tmp\xdebug"

xdebug.trace_output_dir ="D:\ProgramSoft\phpstudy_pro\tmp\xdebug"

xdebug.profiler_output_name = "cache.out.%t-%s"
xdebug.remote_enable = 1
xdebug.remote_handler = "dbgp"
xdebug.remote_host = "127.0.0.1"
xdebug.remote_port = 9000
xdebug.remote_mode = "req"
xdebug.idekey= PHPSTROM
Xdebug在phpstorm中的配置
原文:https://www.cnblogs.com/wakyde/p/11723710.html
评论(0)