MongoDB 学习笔记之 分析器和explain
时间:2017-09-03 20:48:36
收藏:0
阅读:316
MongoDB分析器:
检测MongoDB分析器是否打开:
db.getProfilingLevel()
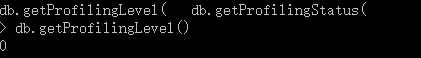
- 0表示没有打开
- 1表示打开了,并且如果查询的执行时间超过了第二个参数毫秒(ms)为单位的最大查询执行时间,就会被记录下来,否则忽略。
- 2表示打开了,并且记录一切查询语句
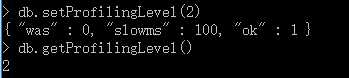
db.setProfilingLevel(2)
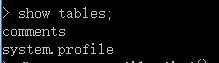
此时发现在test数据库下多了一个system.profile集合:不过此时这个集合还是空的。
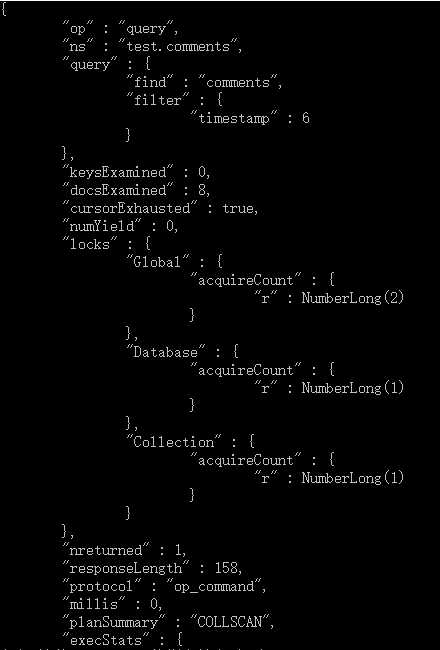
然后我们进行一次查询db.comments.find({timestamp: 6})

然后再查询集合:db.system.profile.find().pretty(),我们可以看到刚才查询的执行计划。
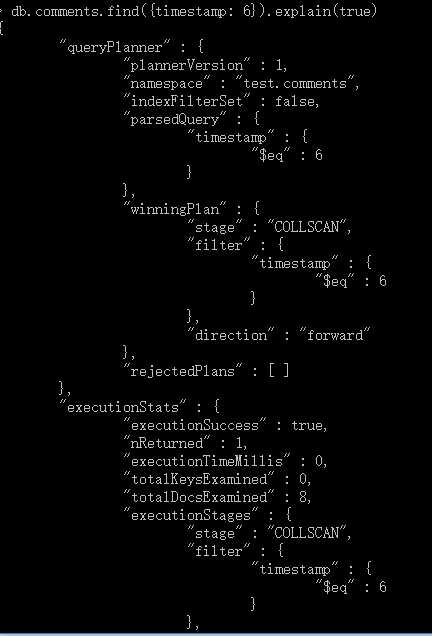
"nReturned" : 1返回行数1
"millis" : 0 执行时间
"stage" : "COLLSCAN" 未使用索引
"docsExamined" : 8 一共扫描了8个文档
由此可见,我们可以通过语句:db.system.profile.find({"query.find": "comments"}).sort({"ts": -1}).limit(1).pretty() 查询出指定语句中最新的执行计划。
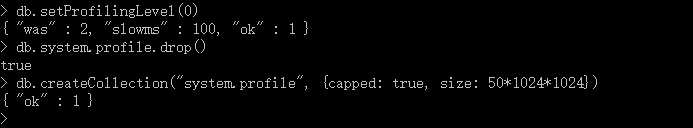
system.profile集合的默认大小为1024KB=1MB,我们来扩大它的大小:
- 关闭MongoDB分析器
- 删除system.profile集合
- 创建50M固定大小的集合
MongoDB explain:
用explain分析特定的查询
db.comments.find({timestamp: 6}).explain(true)
原文:http://www.cnblogs.com/AK47Sonic/p/7470815.html
评论(0)