Utility3:Understand Dashboard Report
To see data in the SQL Server Utility dashboard, select the top node in the Utility Explorer tree - labeled "Utility<UCP_Name>\(ComputerName\UCP)." The dashboard includes summary and detail data from all managed instances of SQL Server and all data-tier applications in the SQL Server Utility. To refresh data in the dashboard, right-click the top node in the Utility Explorer tree, and select Refresh.
Dashboard Report 如下图
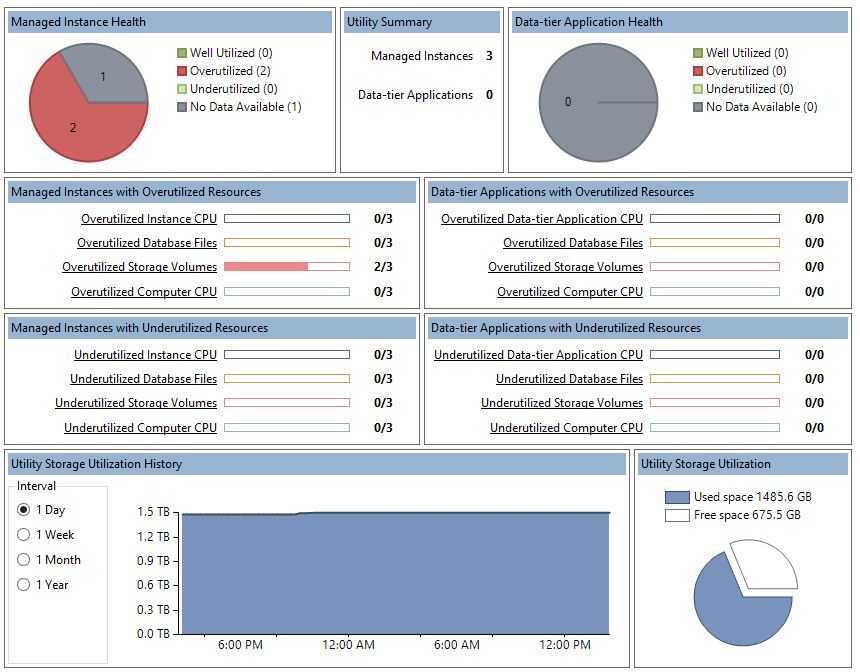
1,health status
- Well-utilized - Number of managed instances of SQL Server which are not violating resource utilization policies.
- Underutilized - Number of managed resources which are violating resource underutilization policies.
- Overutilized - Number of managed resources which are violating resource overutilization policies.
- No Data Available - Data is not available for managed instances of SQL Server either because the instance of SQL Server has just been enrolled and the first data collection operation has not completed, or because there is a problem with the managed instance of SQL Server collecting and uploading data to the UCP.
2,Utility Storage Utilization
Utility Storage 是UCP的所有数据有效的Managed instancde(health status不是No Data Available的Managed instancde)的Storage 加和之后的utilization.
Utility Storage Utilization History
Utilization history is shown in a time graph at the bottom of the SQL Server Utility dashboard. Note that time data show the UCP local date and time using the datetime data type. When using the Utility object model, note that SSMS uses the datetimeoffset data type.
Use the radio buttons to the left of the display area to change the reporting period for the graph.
Options for the reporting interval are:
- 1 Day, displayed in 15-minute intervals.
- 1 Week, displayed in 1-day intervals.
- 1 Month, displayed in 1-week intervals.
- 1 Year, displayed in 1-month intervals.
After you make a change to the reporting interval, the data refreshes automatically.
Utility Storage Utilization
In the bottom right of the dashboard, the storage utilization pie chart displays the ratio of used space to free space on volumes residing on computers that contain managed instances of SQL Server. Data for this display are refreshed every 15 minutes.
3,understand concept
- Instance CPU 是指分配给SQL Server instance的CPU的利用
- Computer 是指SQL Server Instance 所在Server的CPU 的利用
- Database fies是database的Data files 和Log file 对Disk Space的利用
- Storage Volume 是指SQL Server Instance 所在Server的Disk Space的利用
参考文档;
Utility Dashboard (SQL Server Utility)
原文:http://www.cnblogs.com/ljhdo/p/5180195.html